Results 1 to 7 of 7

Thread: Maths - Alternative application for Derive 6

  1. #1
    Join Date
    May 2006
    Location
    The Netherlands
    Beans
    395
    Distro
    Ubuntu Development Release

    Lightbulb Maths - Alternative application for Derive 6

    Hello everybody,

    http://www.chartwellyorke.com/derive.html

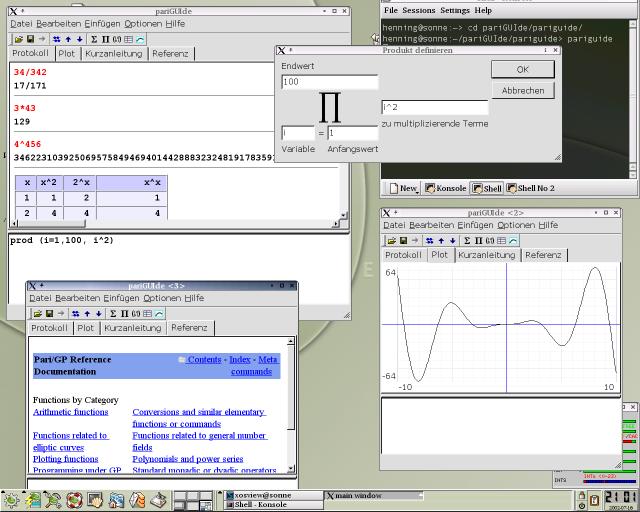
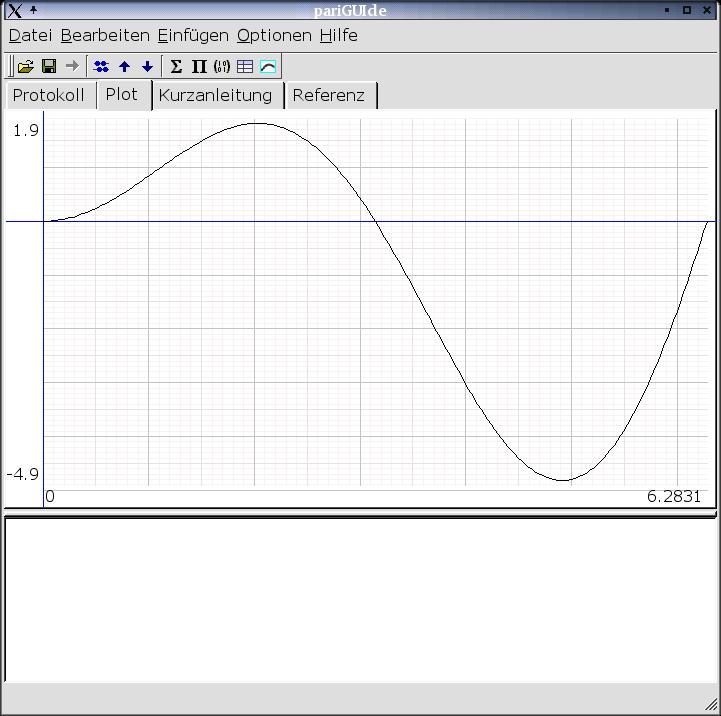
    I have to use the proprietary math application Derive (see link) , I am searching for open source (FLOSS) alternatives for this program,

    Can somebody help me with this problem?

    Many thanks in advance.

  2. #2
    Join Date
    Jan 2007
    Location
    California
    Beans
    350
    Distro
    Ubuntu 12.10 Quantal Quetzal

    Re: Maths - Alternative application for Derive 6

    Plotting--gnuplot
    numerical work--octave
    symbolic work--maxima
    statistics--R

    There might be others, but those are the usual suggestions.

    Hope it helps.
    Euler_fan
    Ubuntu User # 15369 at the Ubuntu Counter Project
    Woot for GPG

  3. #3
    Join Date
    Sep 2007
    Location
    BC, Canada
    Beans
    132
    Distro
    Ubuntu 12.04 Precise Pangolin

    Re: Maths - Alternative application for Derive 6

    Pari, SAGE, and GAP are all useful for a variety of tasks. Do you want to accomplish anything in particular?

    SAGE: http://www.sagemath.org/

    PARI: http://pari.math.u-bordeaux.fr/

    GAP: http://www.gap-system.org/

    If you have more specific tasks you're interested in, there's likely more specific software.

  4. #4
    Join Date
    May 2006
    Location
    The Netherlands
    Beans
    395
    Distro
    Ubuntu Development Release

    Re: Maths - Alternative application for Derive 6

    Thanks you all for posting, I will take it step by step. First I would like to find an application that has an interactive plotter like with you Graphical Calculator. So not a static gnuplot output.

    I could not find the applications: statistics and SAGE

    Code:
    sudo apt-get install pari-doc pari-extra pari-gp pari-gp2c
    sudo apt-get install octave2.9 octave2.9-info octave2.9-doc
    sudo apt-get install wxmaxima maxima-doc
    sudo apt-get install gap
    wxMaxima looks nice! A simple howto to get started with all those tools would be recommended

    I installed pari and I have no idea how to start this program, It is there somewhere: sudo dpkg -S pari
    Last edited by TuxCrafter; October 9th, 2007 at 09:11 AM.

  5. #5
    Join Date
    Jan 2007
    Location
    California
    Beans
    350
    Distro
    Ubuntu 12.10 Quantal Quetzal

    Re: Maths - Alternative application for Derive 6

    For statistics the name of the program is R.

    Google "R" (no quotes) and the site has a very nice intro which will run you through lots of different things.

    There are a number of threads in this part of the forums related to R if you want more information, especially about gui front ends.
    Euler_fan
    Ubuntu User # 15369 at the Ubuntu Counter Project
    Woot for GPG

  6. #6
    Join Date
    May 2006
    Location
    The Netherlands
    Beans
    395
    Distro
    Ubuntu Development Release

    Re: Maths - Alternative application for Derive 6

    Thanks, for clearing up the R issue.

    I would like to start with something simple like plotting the following below functions and interactively change the max and min values of X and Y. Then I would like to interactively go to the min,max and intersection points with the X and Y-ax of the functions.

    y=½x²+6x+5
    y=-¼x²+2x
    y=2x²-6x+5
    y=-2x²-8x

    Which application is the most suitable for this job?

  7. #7
    Join Date
    Sep 2007
    Location
    BC, Canada
    Beans
    132
    Distro
    Ubuntu 12.04 Precise Pangolin

    Re: Maths - Alternative application for Derive 6

    Quote Originally Posted by TuxCrafter View Post
    Thanks, for clearing up the R issue.

    I would like to start with something simple like plotting the following below functions and interactively change the max and min values of X and Y. Then I would like to interactively go to the min,max and intersection points with the X and Y-ax of the functions.

    y=½x²+6x+5
    y=-¼x²+2x
    y=2x²-6x+5
    y=-2x²-8x

    Which application is the most suitable for this job?
    pari/gp has a simply yet functional plotting facility:


    Code:
                                         ^--------
    ? plot(x=0,1,x^2)
    
            1 |'''''''''''''''''''''''''''''''''''''''''''''''''''''''''''''_"
              |                                                            x |
              |                                                          _"  |
              |                                                         x    |
              |                                                       _"     |
              |                                                     _"       |
              |                                                    x         |
              |                                                  x"          |
              |                                                _"            |
              |                                              _"              |
              |                                            _"                |
              |                                          _"                  |
              |                                        x"                    |
              |                                     _x"                      |
              |                                   _x                         |
              |                                _x"                           |
              |                             _x"                              |
              |                          _x"                                 |
              |                      __x"                                    |
              |                  _xx"                                        |
              |            __xx""                                            |
            0 ______xxxx""",,,,,,,,,,,,,,,,,,,,,,,,,,,,,,,,,,,,,,,,,,,,,,,,,,,
              0                                                              1
    If you want a proper graphical representation, the ploth() command works. This gives a graph of the sin() function from 0 to 2pi:

    ploth(x=0,2*Pi,sin(x))

    I ran that command in the gp interface. One you've installed pari/gp, just type "gp" at the prompt and you'll enter the command-line interface.

    The nice thing about pari/gp is it is a language, so you can do a lot of scripting. It probably wouldn't be too much work to make a python script to create a GUI for all the features you're looking for. Somebody may have done that, for all I know. I'll keep my eyes open for it. Very likely SAGE *has* such a GUI interface. I haven't installed it (yet) on my system, because it's such a huge package.

    If you want to install SAGE, you're going to have to go to the SAGE webpage and follow the install instructions. It is not in the Ubuntu repository yet. SAGE's goal is to be a Mathematica/MatLab/Maple open-source complete replacement.

    Ah, here is a minimalist GUI for pari/gp so that you won't have to install the whole SAGE package. It's called "pariguide":

    Screenshots:


    Webpage: http://www.skalatan.de/pariguide/
    Last edited by rybu; October 10th, 2007 at 06:05 PM.

Bookmarks

Posting Permissions

  • You may not post new threads
  • You may not post replies
  • You may not post attachments
  • You may not edit your posts
  •