@ dannyboy79
Why thank you FrankenCub, I try.

Yup, I agree these that [ ]: blocks look strange but it's a users option
If your taking them out make two changes
Above TEXT in the colour section change color9 to this:
Code:
color9 FF0000 #255 0 0 Red
Then change that sections to:
Code:
TEXT
${color9}SYSTEM ${hr 1}${color}
${nodename}
${sysname} ${kernel} Uptime: ${uptime}
There is no sense in changing the colour to green and then back to the default.
Now do a search|replace ${color green} to ${color3} - replace all
Another search|replace ${color ffff00} to ${color8} - replace the one
As for sensors to get the temp I use the "platform" method ... there are three options:
- the old awk, grep, sed way - requires an ${exec} command
- using hwmon ${hwmon} - sometimes they change, and
- platform ${platform} - stable always the same.
mrpeachy updated the HowTo at Conky PitStop
And like most people while "some" sensors readings are easy to figure out what about temperatures. Drives a person
MAD ...
mad I tell you ...
MAD! ... just trying to figuring them out.
I have 3 temp1's a temp2 and a temp 3 - but what are they for:
Code:
 17 Dec 12 | 08:44:09 ~
         $ sensors
acpitz-virtual-0
Adapter: Virtual device
temp1:        +30.0°C  (crit = +110.0°C)

k10temp-pci-00c3
Adapter: PCI adapter
temp1:        +34.5°C  (high = +70.0°C)

f71862fg-isa-0a00
Adapter: ISA adapter
+3.3V:        +3.44 V
in1:          +1.35 V
in2:          +1.51 V
in3:          +0.86 V
in4:          +0.00 V
in5:          +0.00 V
in6:          +0.00 V
3VSB:         +3.39 V
Vbat:         +2.93 V
fan1:        2431 RPM
fan2:           0 RPM  ALARM
fan3:           0 RPM  ALARM
temp1:        +44.0°C  (high = +85.0°C, hyst = +81.0°C)
                       (crit = +70.0°C, hyst = +66.0°C)  sensor = transistor
temp2:        +39.0°C  (high = +85.0°C, hyst = +81.0°C)
                       (crit = +100.0°C, hyst = +96.0°C)  sensor = thermistor
temp3:       +127.0°C  (high = +70.0°C, hyst = +68.0°C)  ALARM (CRIT)
                       (crit = +85.0°C, hyst = +83.0°C)  sensor = transistor


 17 Dec 12 | 08:44:26 ~
         $
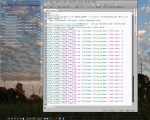
A little while back I found
inxi - personally I think it should be a default install on all distros. Do yourself a favour and check it out.
Code:
 17 Dec 12 | 09:03:17 ~
         $ s11
System:    Host: sector11 Kernel: 3.6.0-3.dmz.2-liquorix-amd64 x86_64 (64 bit)
           Desktop: Openbox 3.5.0 Distro: Debian GNU/Linux 7.0
Machine:   Mobo: ECS model: MCP61M-M3 version: 7.0 Bios: American Megatrends version: 080015 date: 11/03/2010
CPU:       Triple core AMD Athlon II X3 450 (-MCP-) cache: 1536 KB flags: (lm nx sse sse2 sse3 sse4a svm)
           Clock Speeds: 1: 3214.513 MHz 2: 3214.513 MHz 3: 3214.513 MHz
Graphics:  Card: NVIDIA GT218 [GeForce 210] X.Org: 1.12.4 driver: nvidia Resolution: 1280x1024@75.0hz
           GLX Renderer: Gallium 0.4 on llvmpipe (LLVM 0x209) GLX Version: 2.1 Mesa 8.0.5
Audio:     Card-1: NVIDIA MCP61 High Definition Audio driver: snd_hda_intel Sound: ALSA ver: 1.0.25
           Card-2: NVIDIA High Definition Audio Controller driver: snd_hda_intel
Network:   Card: NVIDIA MCP61 Ethernet driver: forcedeth
           IF: eth0 state: up speed: 100 Mbps duplex: full mac: <filter>
Drives:    HDD Total Size: 250.1GB (19.2% used) 1: id: /dev/sda model: WDC_WD2500AAJS size: 250.1GB
Partition: ID: / size: 9.2G used: 4.3G (50%) fs: ext4 ID: /home size: 14G used: 4.9G (38%) fs: ext4
           ID: swap-1 size: 4.00GB used: 0.00GB (0%) fs: swap
Sensors:   System Temperatures: cpu: 45.0C mobo: 39.0C gpu: 48C
           Fan Speeds (in rpm): cpu: 2463 fan-2: 0 fan-3: 0
Info:      Processes: 128 Uptime: 59 min Memory: 533.7/5963.0MB Client: Shell inxi: 1.8.19

 17 Dec 12 | 09:03:25 ~
         $
I made aliases -
s11 is the short display. You should see the full display. Now it's easy to match the temps - fan speeds etc with the right places they are used.
hddtemp - is still required for hard drives
Examples:
Code:
${execi 15 hddtemp -n /dev/sda}°
${execi 15 hddtemp -n /dev/sdb}°
${execi 15 hddtemp -n /dev/sdc}°
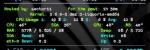
This is what I use in my main conky for temps:
Code:
${color3}CPU: ${color}${platform f71882fg.2560 temp 1}°${goto 120}${color3}SDA: ${color}${execi 15 hddtemp -n /dev/sda}°${goto 222}${color3}GPU: ${color}${nvidia temp}° ${alignr 5}${color3}MB: ${color}${platform f71882fg.2560 temp 2}°
 Free Image Hosting by imgbox.com
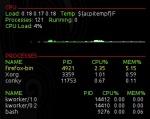
Another thing you might want to do is tidy up your Processes area. Check out the bottom of the page where it says:
Thanks to Jackzor & djyoung4, for making me aware of this missing tidbit:
NOTE: If you are using the code I gave you the 'pad_percents 2' line is already there.
And maybe add a PROCESSES line in there while your at it:
Code:
${color9}PROCESSES ${hr 1}${color}
${color3}NAME             ${alignr}PID       CPU%      MEM%
See it works well - I did the top 4 lines, the bottom 4 are your method:


Originally Posted by dannyboy79


 Adv Reply


Bookmarks